Batch Viewing Of Ucsc Browser Graphic
4
4
Entering edit mode
13.1 years ago
Sequencegeek ▴ 740

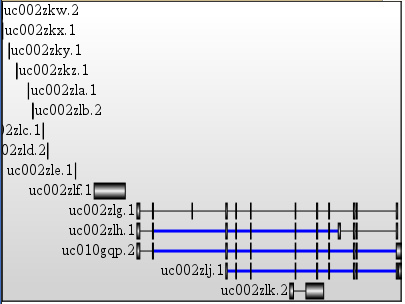
Often times I need to pick out good looking examples of NGS results from a list that can be up to 3000 items long. For instance, there might be a set of spliced exons in my data and I need to show the RNA-Seq expression visually for each one.

Ideally I'd like to be able to get the UCSC Genome Browser graphic for each one by setting up the UCSC Genome Browser with specific tracks (including my own custom ones) and submitting a list of coordinates.

Is there anything in the API that can help me do this?

or

Can someone suggest a way to parse the image from the webpage? I'm pretty sure I can download each page for the sequence using wget, but I'm not too familiar with this area and I'm sure someone has a better way to do it.

Thanks.

ucsc • 7.9k views
ADD COMMENT
0
Entering edit mode

(removed comment)

ADD REPLY
8
Entering edit mode
13.1 years ago
Aaron Statham ★ 1.1k

Here is an R script I hacked together a few years ago which saves UCSC to pdfs - you can choose which genome and tracks to display by altering the 'url' parameter. 'trackfile' is the url of a file describing the custom tracks (beds/bigwigs) to display

screenshotUCSC <- function(url, trackfile, chr, start, end, filename) {
        oldpen <- options("scipen")
        options(scipen=100)
        temp <- readLines(paste(url, "&hgt.customText=", trackfile, "&position=",chr,":",start,"-",end, sep=""))
        pdfurl <- paste("http://genome.ucsc.edu/trash",gsub(".*trash","",gsub(".pdf.*","",temp[grep(".pdf", temp, fixed=TRUE)])), ".pdf", sep="")
        options(scipen=oldpen)
        download.file(pdfurl, filename, mode="wb", quiet=TRUE)  
}

library(multicore)
mclapply(1:nrow(toPlot), function(i) screenshotUCSC("http://genome.ucsc.edu/cgi-bin/hgTracks?db=hg18&wgRna=hide&cpgIslandExt=pack&ensGene=hide&mrna=hide&intronEst=hide&mgcGenes=hide&hgt.psOutput=on&cons44way=hide&snp130=hide&snpArray=hide&wgEncodeReg=hide&pix=1000&refGene=pack&knownGene=hide&rmsk=hide",
"URL_of_your_custom_track", toPlot$space[i], toPlot$start[i]-3000, toPlot$start[i]+2999, paste("Figures/Shots/Low_To_High_", i, ".pdf", sep="")), mc.cores=10)
ADD COMMENT
1
Entering edit mode

BTW, this worked very nicely - thanks. We hacked a solution based off of this and here are a few tips for others in case they want to do the same thing: You may have to manually change the track display mode to full in the HTML depending on what you want. UCSC offers a Session which allows you to save uploaded data for later use - you can share these with others.

ADD REPLY
0
Entering edit mode

I don't know why but the code doesn't work for me and I got this error?

Error in download.file(pdfurl, filename, mode = "wb", quiet = TRUE) : 
  cannot open URL 'http://genome.ucsc.edu/trash.pdf'
In addition: Warning message:
In download.file(pdfurl, filename, mode = "wb", quiet = TRUE) :
  cannot open: HTTP status was '404 Not Found'
ADD REPLY
7
Entering edit mode
13.1 years ago

Ok, here is a solution.

Use the mysql server of the UCSC and use the -X option to produce a XML document.

> genome-mysql.cse.ucsc.edu -A -u genome -D hg19  -e 'select * from knownGene where chrom="chr22" limit 5,15' -X > mysql.xml

The file looks like:


<resultset statement="select * from knownGene where chrom=" chr22"="" limit="" 5,15="" "="" xmlns:xsi="&lt;a href=" http:="" www.w3.org="" 2001="" XMLSchema-instance"="" rel="nofollow">http://www.w3.org/2001/XMLSchema-instance">
  <row>
        <field name="name">uc002zkw.2</field>
        <field name="chrom">chr22</field>
        <field name="strand">-</field>
        <field name="txStart">16240244</field>
        <field name="txEnd">16240281</field>
        <field name="cdsStart">16240244</field>
        <field name="cdsEnd">16240244</field>
        <field name="exonCount">1</field>
        <field name="exonStarts">16240244,</field>
        <field name="exonEnds">16240281,</field>
        <field name="proteinID"></field>
        <field name="alignID">uc002zkw.2</field>
  </row>

process the XML file with a XSLT stylesheet to produce a SVG file. I quickly wrote one for this question here.

xsltproc ucsc-sql2svg.xsl mysql.xml > result.svg

and the result visualized in firefox:

http://lindenb.tumblr.com/

ADD COMMENT
0
Entering edit mode

Can the -X option be used to display custom tracks in full also?

ADD REPLY
0
Entering edit mode
12.4 years ago
Mark • 0

check www.awserver.net for their e marketing tools, they can record any information on the web to the local files.

ADD COMMENT
0
Entering edit mode
12.4 years ago
Pascal ▴ 20

You also might want to give the Integrative Genomics Viewer (IGV) a try. Load the tracks you are interested in into the browser. Then write a batch file like described here:

http://www.broadinstitute.org/software/igv/batch

or control IGV by port

http://www.broadinstitute.org/igv/PortCommands

Both methods let you take snapshots of regions you specify.

ADD COMMENT

Login before adding your answer.

Traffic: 2565 users visited in the last hour
Help About
FAQ
Access RSS
API
Stats

Use of this site constitutes acceptance of our User Agreement and Privacy Policy.

Powered by the version 2.3.6