My general answer would be to use image(). I never really liked the way heatmap.2 looked.
Here's my image plot function with a corresponding color scale.
mcm_image<-function(data,colors,title="",zlim=c(floor(min(data,na.rm=T)),ceiling(max(data,na.rm=T))),addgrid=F,cexCol=.8,cexRow=.1,...)
{
    library(RColorBrewer)
    par(mar=c(7,2,4,7))
    image(t(data[nrow(data):1,]),axes=F,col=colors,zlim=zlim)

    #adding the grid.
    if(addgrid)
    {
        abline(v=seq(-1*seq(0,1,length.out=ncol(data))[2]/2,1+seq(0,1,length.out=ncol(data))[2]/2,length.out=ncol(data)+1),lwd=.1,col='white')
        abline(h=seq(-1*seq(0,1,length.out=nrow(data))[2]/2,1+seq(0,1,length.out=nrow(data))[2]/2,length.out=nrow(data)+1),lwd=.1,col='white')
    }

    axis(1, at=seq(0,1,length.out=ncol(data)),labels=colnames(data),tick=F,las=2,cex.axis=cexCol,line=-.5)
    axis(4, at=seq(0,1,length.out=nrow(data)), labels=rev(rownames(data)), tick=F,las=2,cex.axis=cexRow,line=-.5)
    mtext(title,side=3,outer=F,cex=1,line=1)

    colorBar <- function(n,col.grad,zlim){
        ColorLevels <- seq(zlim[1],zlim[2],length.out=length(col.grad))
        labels <- seq(zlim[1],zlim[2],length.out=6)
        par(mar=c(1,4,4,5))
        image(t(matrix(ColorLevels,ncol=1)),axes=F,col=col.grad)
        axis(4,at=seq(0,1,length.out=6),tick=F,labels=round(labels,digits=0),cex.axis=.9,las=2,line=-.5)
        mtext("Scale",side=3,outer=F,cex=.6,line=.4)
    }
    colorBar(data,colors,zlim);

}

library(RColorBrewer)
h<-heatmap(as.matrix(data))
nf<-layout(matrix(data=c(1,1,1,2,0,0),nrow=3,ncol=2),widths=c(13,3),TRUE)
layout.show(nf)
mcm_image(data=as.matrix(data)[h$rowInd,h$colInd],colors=colorRampPalette(brewer.pal(9,"Blues")((100),title="Gene Expression in Mouse Tissues",zlim=c(0,130000),addgrid=F)
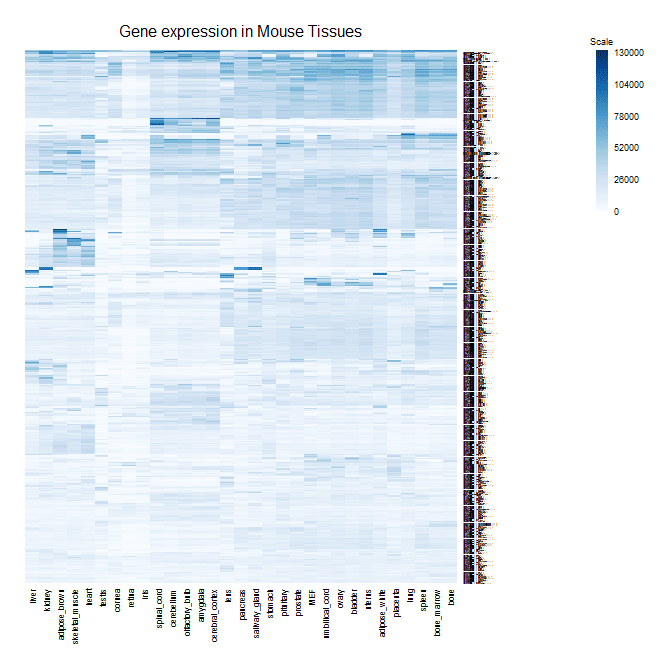


That looks good!! thanks a lot Madelaine
hello,
suppose that i have already downloaded GSE63706 and normalized that and i have a normalized text file now. and i have also a list of probsets (a text file of my interest probsets) in this array...i want to have a heat map showing the expression pattern of my interest probsets in this array, for example in this array i have 4 varieties and different tissues (rind and flesh) and phases (0,10,20,30,40 and 50 days after harvesting). heat maps showing the expression pattern of my probsets in varieties, tissues and phases i mean
please...