Is there a way to visualize log fold changes for Reactome pathways in R?
3
4
Entering edit mode
5.0 years ago
Gabriel ▴ 150

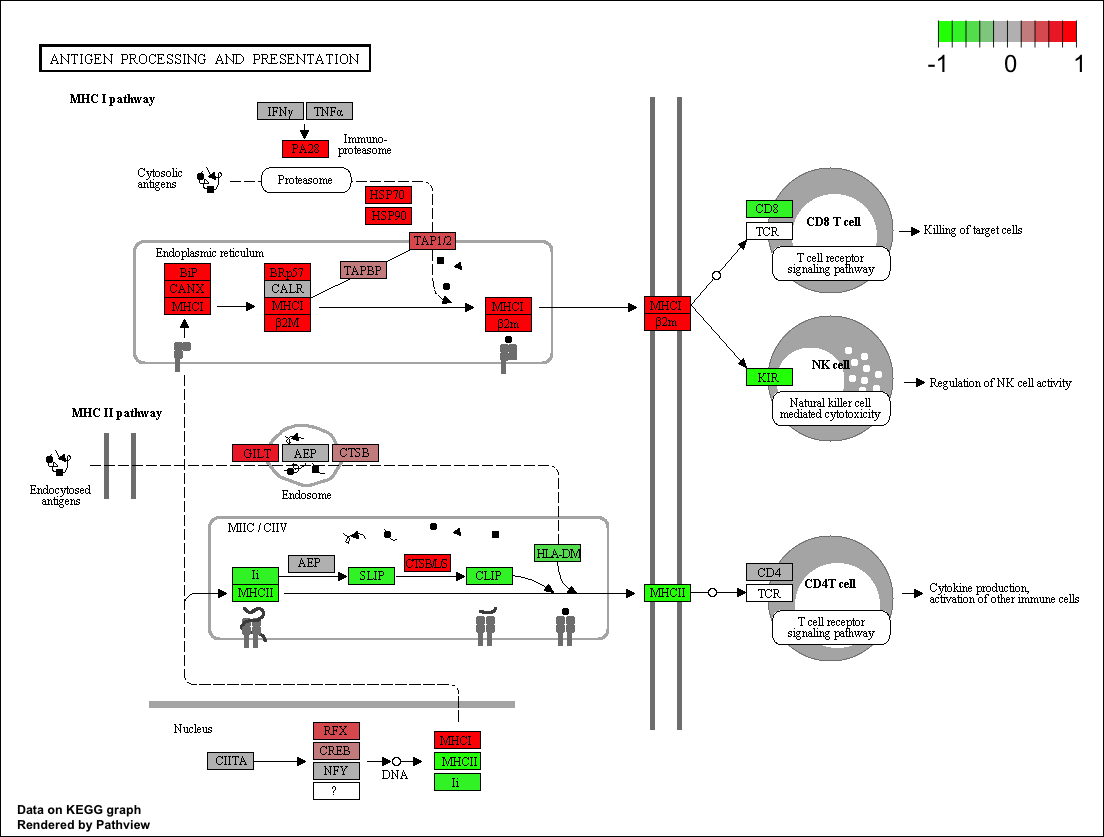
With KEGG, we can use the tool Bioconductor to plot our pathways with the logfold changes for our datasets, using R. Like this:

Pathview visualization of fold changes This can also be done with WikiPathways and Cytoscape, by downloading the images and uploading the fold changes into cytoscape via R tools such as RCy3.

Can the same be done with Reactome? I preferrably want the pathways in the original representation as shown on the svg file on the reactome website. Like this: reactome svg patway image But with log fold changes. There is a way to do this in ReactomePA, but it shows the result in a dissociated network diagram that is hard to make sense out of.

pathview RNA-Seq reactome bioconductor • 5.3k views
ADD COMMENT
0
Entering edit mode

Hi, Gabriel!

Any chance you found out how to do this?

ADD REPLY
0
Entering edit mode

Please do not add comments as answers - use the "Add Comment" or "Add Reply" buttons as necessary to help keep things organized.

Additionally, piggybacking on old questions is rarely an effective method to get help, though we do appreciate you searching for them. If you have a question and cannot find the answer, please post a new question with sufficient detail to understand your issue(s) and goal(s), ideally with a reproducible example if possible.

ADD REPLY
0
Entering edit mode

Sorry, that was unintentional, but completely my bad! Thanks for fixing it.

Since there were no solutions to this here, I was not sure how else to contact Gabriel to ask if maybe they had figured this out. Is commenting on an un-answered thread to get it back on the 'latest' queue and potentially getting clarifications from the OP worse than re-posting a similar/same question again? I didn't know that, it felt more intuitive to expand on something already written to have it all in one place instead of another separate thread, but I will keep this in mind, thanks.

ADD REPLY
0
Entering edit mode

This post is a year and a half old and Gabriel is not an active user. Regardless, your question buried in a comment is a lot less likely to get attention from other users than a new one. You can even link this question, mention that it got no attention, and provide details specific to your situation, etc. That shows you made the effort to search the site first.

However, a question as straightforward as this would probably have an answer if there was one easily found (and I'm sure you've done your fair share of googling as well). Feel free to open a new question, but I wouldn't get your hopes up too high.

ADD REPLY
0
Entering edit mode

Thanks for the clarification and the additional tips, Jared!

ADD REPLY
4
Entering edit mode
3.4 years ago
kelen ▴ 200

One potential way I found for doing this is through using the Wikipathways .gpml version of Reactome pathways and Pathvisio. It won't preserve the exact coloring scheme, but that might be manually possible in Pathvisio. For a quick test-run I just downloaded a pathway from here (https://www.wikipathways.org/index.php?title=Special:CurationTags&showPathwaysFor=Curation%3AReactome_Approved) and followed these (https://pathvisio.github.io/tutorials/multi-omics-tutorial.html) instructions to format a dummy input file for the first five genes listed underneath the pathway image I was using with made up negative and positive LFC.

Screenhot (the blue hue on the map is accidental as I left the cursor on it): Screenshot-from-2020-12-07-16-52-40

It seems PathVisio is moving their documentation website so I assume there will be a more informative tutorial on these functionalities or maybe they are somewhere, but I struggled to easily find them.

ADD COMMENT
3
Entering edit mode
3.2 years ago
darklings ▴ 570

Using bioconductor packages ReactomeGSA and ReactomeContentService4R you can get something like this

Code example sees the Diagram exporter section.

enter image description here

ADD COMMENT
1
Entering edit mode
3.1 years ago
bigmawen ▴ 430

The SBGNview package is the tool to work with major pathway databases including Reactome, MetaCyc, SMPDB, PANTHER etc:
GitHub
https://github.com/datapplab/SBGNview
BioC
https://bioconductor.org/packages/SBGNview/

SBGNview is a tool set for pathway based data visualization, integration and analysis. SBGNview is similar and complementary to the widely used Pathview package, with the following key features:
• Pathway definition by the widely adopted Systems Biology Graphical Notation (SBGN);
• Supports multiple major pathway databases beyond KEGG (Reactome, MetaCyc, SMPDB, PANTHER, METACROP etc) and user defined pathways;
• Covers 5,200 reference pathways and over 3,000 species by default;
• Extensive graphics controls, including glyph and edge attributes, graph layout and sub-pathway highlight;
• SBGN pathway data manipulation, processing, extraction and analysis.

You may find an overview and quick start examples here:
https://github.com/datapplab/SBGNview
Main tutorial:
https://bioconductor.org/packages/release/bioc/vignettes/SBGNview/inst/doc/SBGNview.Vignette.html

Example visualization with Reactome pathway:
R-HSA-909733_Interferon alpha_beta signaling

Example visualization with PANTHER pathway:
enter image description here

ADD COMMENT

Login before adding your answer.

Traffic: 2748 users visited in the last hour
Help About
FAQ
Access RSS
API
Stats

Use of this site constitutes acceptance of our User Agreement and Privacy Policy.

Powered by the version 2.3.6