Wgcna blockwisemodules: lower power results in modules with positive and negative kme values.
2
1
Entering edit mode
5.6 years ago
ductylerlv ▴ 10

Hello All,

Our lab is getting some interesting results whereby we have modules that have both positive and negative kme values in a signed network. If a higher power is used this goes away but the lower power already surpasses the R2 and k.means thresholds. Any insight would be helpful.

Best,
Duc

wgcna • 4.6k views
ADD COMMENT
1
Entering edit mode

can you post the code ?what you had done?

ADD REPLY
0
Entering edit mode

I was the one who encountered negative and non-correlated kME values for specific network nodes in WGCNA with the following input and code. The soft threshold criterion for scale free topology was met at power, beta, 7.6. We chose 8.5 to reduce noise further. SFT power vs. R² for this dataset

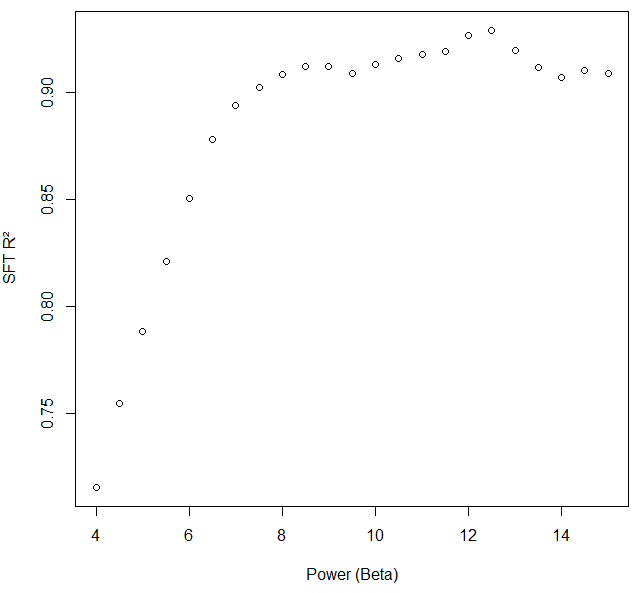
And the resulting protein network has module(s) like the below violet module, where we never usually see kMEintramodule<0.20, but here we do: lower kME violet module members

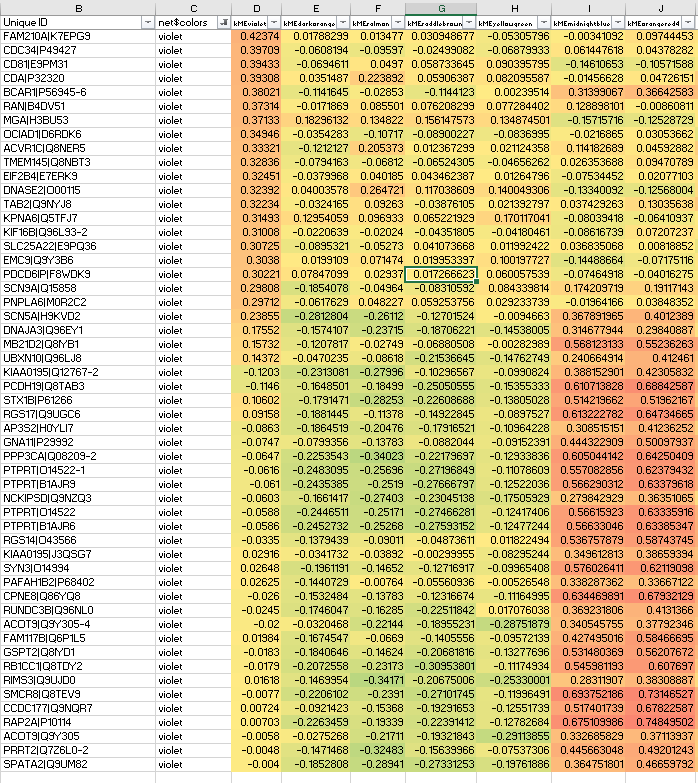
Clearly some of the lower violet module members should go to orangered4 with kMEorangered4>0.7.

Interestingly, some orangered non-hub members suffer from anticorrelation to their own ME, precisely what should not be seen in signed network modules: lower kME orangered4 module members

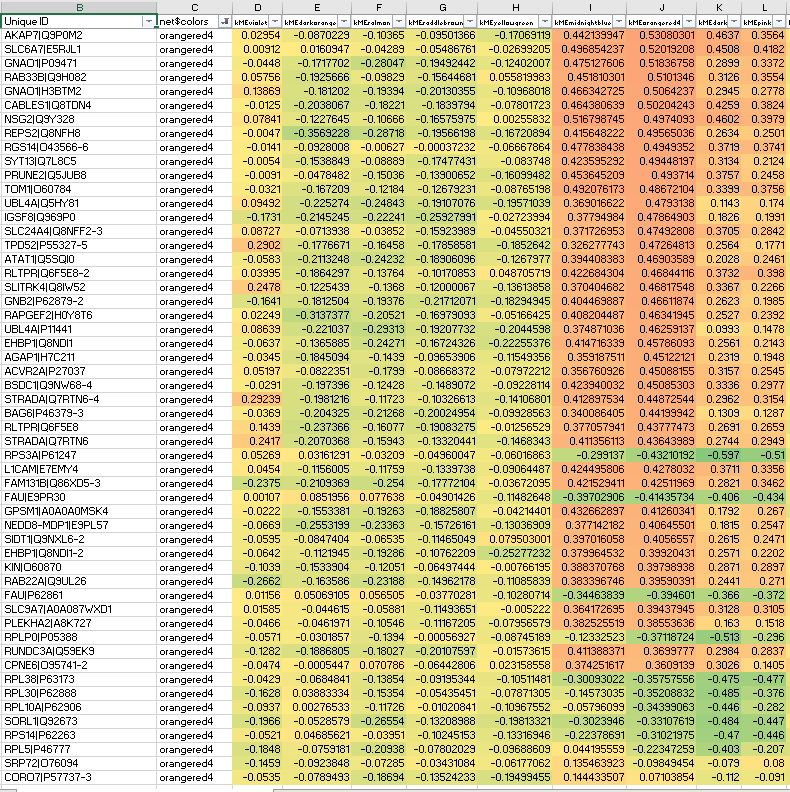
Full code to reproduce the problem follows:

rm(list=ls())
options(stringsAsFactors=FALSE)
rootdir <- "drive:/folder/location/" # This is the folder containing all of the analysis scripts, input, and output for this project

library(WGCNA)
allowWGCNAThreads()

setwd(rootdir)
cleanDat<-read.table(file=paste0(rootdir,"/final_cleanDat_11240x243_BootAgeSexPMIregr_DxNumericProtected_regr_Sept20_2018.txt"),sep="\t")

allowWGCNAThreads()
powers <- seq(4,15,by=0.5)
tableSFT<-pickSoftThreshold(t(cleanDat),powerVector=powers,corFnc="bicor",blockSize=15000,verbose=3,networkType="signed")[[2]] #,corFnc="bicor"
plot(tableSFT[,1],tableSFT[,2],xlab="Power (Beta)",ylab="SFT R²")

# pickSoftThreshold: calculating connectivity for given powers...
#   ..working on genes 1 through 11240 of 11240
#   Power SFT.R.sq slope truncated.R.sq mean.k. median.k. max.k.
#1    4.0    0.715 -8.28          0.959  810.00    790.00 1150.0
...
#8    7.5    0.903 -4.52          0.991  104.00     94.50  254.0
#9    8.0    0.909 -4.23          0.994   79.00     70.90  211.0
...

powers <- seq(7.6,7.9,by=0.1)
tableSFT<-pickSoftThreshold(t(cleanDat),powerVector=powers,corFnc="bicor",networkType="signed")
#plot(tableSFT[,1],tableSFT[,2],xlab="Power (Beta)",ylab="SFT R²")
tableSFT$powerEstiamte
#[1] 7.6

#  Power SFT.R.sq slope truncated.R.sq mean.k. median.k. max.k.
#1   7.6    0.905 -4.46          0.992    98.3      89.2    245
#2   7.7    0.904 -4.41          0.992    93.1      84.2    236
#3   7.8    0.905 -4.35          0.993    88.1      79.5    227
#4   7.9    0.907 -4.29          0.993    83.5      75.0    219

## Run an automated network analysis (WGCNA 1.64 Rx64 v3.5.1 WINDOWS)

power=8.5; #first tried: 7.6
minModSize=30
enforceMMS=FALSE

net <- blockwiseModules(t(cleanDat),power=power,deepSplit=4,minModuleSize=minModSize,
                        mergeCutHeight=0.07, TOMDenom="mean", #detectCutHeight=0.9999,
corType="bicor",networkType="signed",pamStage=TRUE,pamRespectsDendro=TRUE,reassignThresh=0.05,
                        verbose=3,saveTOMs=FALSE,maxBlockSize=12000)

# Summary Module Table
table(net$colors)["grey"] #3179/11,240 are grey/unassigned.

nModules<-length(table(net$colors))-1
modules<-cbind(colnames(as.matrix(table(net$colors))),table(net$colors))
orderedModules<-cbind(Mnum=paste("M",seq(1:nModules),sep=""),Color=labels2colors(c(1:nModules)))
modules<-modules[match(as.character(orderedModules[,2]),rownames(modules)),]
as.data.frame(cbind(orderedModules,Size=modules))

#                Mnum           Color Size
#turquoise         M1       turquoise  643
#blue              M2            blue  494
#brown             M3           brown  423
...

tmpMEs <- MEs <- net$MEs
colnames(tmpMEs) <- paste("ME",colnames(MEs),sep="")
kMEdat <- signedKME(t(cleanDat), tmpMEs, corFnc="bicor")

write.table(cbind(rownames(cleanDat),net$colors,kMEdat),file=paste(rootdir,"/ModuleAssignments_TOMdenomMEAN_netPwr",power,"_MergeHeight0.07_PAMstageTRUE.txt",sep=""),sep="\t")

Formatted ModuleAssignments (kME table) can be found here: Excel Binary kME Table for above network output

Input for cleanDat log2(abundance) matrix loaded in above code is here: ZIP with log2(abundance) matrix text tab-separated file

...explicit use of minKMEtoStay=0.30 has never been necessary before.

ADD REPLY
0
Entering edit mode

I should add that minKMEtoStay=0.30 is a default parameter/setting: blockwiseModules in WGCNA v1.64 default parameters

Rerunning the above blockwiseModules() function with this parameter added to the others gives identical modules.

My sessionInfo follows:

> sessionInfo()
R version 3.5.1 (2018-07-02)
Platform: x86_64-w64-mingw32/x64 (64-bit)
Running under: Windows 10 x64 (build 17134)

Matrix products: default

locale:
[1] LC_COLLATE=English_United States.1252  LC_CTYPE=English_United States.1252   
[3] LC_MONETARY=English_United States.1252 LC_NUMERIC=C                          
[5] LC_TIME=English_United States.1252    

attached base packages:
[1] stats     graphics  grDevices utils     datasets  methods   base     

other attached packages:
[1] WGCNA_1.64-1          fastcluster_1.1.25    dynamicTreeCut_1.63-1

loaded via a namespace (and not attached):
 [1] Biobase_2.40.0        bit64_0.9-7           splines_3.5.1         foreach_1.4.4        
 [5] Formula_1.2-3         assertthat_0.2.0      stats4_3.5.1          latticeExtra_0.6-28  
 [9] blob_1.1.1            fit.models_0.5-14     robustbase_0.93-2     impute_1.54.0        
[13] pillar_1.3.0          RSQLite_2.1.1         backports_1.1.2       lattice_0.20-35      
[17] glue_1.3.0            digest_0.6.17         RColorBrewer_1.1-2    checkmate_1.8.5      
[21] colorspace_1.3-2      htmltools_0.3.6       preprocessCore_1.42.0 Matrix_1.2-14        
[25] plyr_1.8.4            pcaPP_1.9-73          pkgconfig_2.0.2       purrr_0.2.5          
[29] GO.db_3.6.0           mvtnorm_1.0-8         scales_1.0.0          htmlTable_1.12       
[33] tibble_1.4.2          IRanges_2.14.11       ggplot2_3.0.0         nnet_7.3-12          
[37] BiocGenerics_0.26.0   lazyeval_0.2.1        survival_2.42-6       magrittr_1.5         
[41] crayon_1.3.4          memoise_1.1.0         doParallel_1.0.11     MASS_7.3-50          
[45] foreign_0.8-71        tools_3.5.1           data.table_1.11.4     matrixStats_0.54.0   
[49] stringr_1.3.1         S4Vectors_0.18.3      munsell_0.5.0         cluster_2.0.7-1      
[53] AnnotationDbi_1.42.1  bindrcpp_0.2.2        compiler_3.5.1        rlang_0.2.2          
[57] grid_3.5.1            iterators_1.0.10      rstudioapi_0.7        htmlwidgets_1.2      
[61] robust_0.4-18         base64enc_0.1-3       gtable_0.2.0          codetools_0.2-15     
[65] DBI_1.0.0             rrcov_1.4-4           R6_2.2.2              gridExtra_2.3        
[69] knitr_1.20            dplyr_0.7.6           bit_1.1-14            bindr_0.1.1          
[73] Hmisc_4.1-1           stringi_1.2.4         parallel_3.5.1        Rcpp_0.12.18         
[77] rpart_4.1-13          acepack_1.4.1         DEoptimR_1.0-8        tidyselect_0.2.4     
>
ADD REPLY
0
Entering edit mode

Did I provide too much information? Hoping to get some feedback.

ADD REPLY
2
Entering edit mode

Perhaps this answer from the WGCNA developer helps? - https://support.bioconductor.org/p/101579/

ADD REPLY
1
Entering edit mode
5.1 years ago
edammer ▴ 20

Thanks Kevin and all who have looked at this issue-- Peter Langfelder suggested bypassing use of TOM for the dissimilarity metric used to cluster, which can disagree sometimes substantially with expected module membership based on kME table (based on the experience with this and similar large multi-batch, batch-corrected, data). The batch variance removal prior to WGCNA blockwiseModules() may/may not play a role, which begame the focus of the above post. Regardless, adding the parameter to bypass TOM and use the adjacency matrix instead, TOMType="none" seems to have handled all abnormal assignments in a kME table of a similar network, and I suspect it will work for these data. Cf. interactions on the bioconductor forum for more of Peter's response.

Practical solution found -- I recommend Duc close this thread!

ADD COMMENT
0
Entering edit mode

Thank you for posting this. Indeed, it was better to hear the developer's (Peter's) thoughts on this, which seems to be a very obscure problem. I have toggled your answer to Accepted, as it may help others arriving here in the future.

ADD REPLY
1
Entering edit mode
5.2 years ago
edammer ▴ 20

I can say that running WGCNA_1.64-1 on R v3.5.1 today with the same input data but passed through a more robust normalization by median polish does not have any module member (non-grey) with a kME below +0.29, and signed aspect of the network (networkType="signed" parameter for blockwiseModules() ) appears to be working on the slightly different input protein abundance matrix. I checked the kME table and found NO non-grey module with any members having negative correlation or kME<0.29 . Thus, the prior 2-step batch normalization procedure may have caused something in the correlation structure to trip up WGCNA enforcement of signed modules, though I am not sure why. Perhapsfocusing on data normality and variance correlation could bring some clarity for others, so I thought I would post this experience.

ADD COMMENT
0
Entering edit mode

Great. So, you are implying that the issue was the distribution of the input data? If you feel that this answers your own question, then, perhaps, you can accept your own answer so that this thread will no longer be 'bumped' to the main page listing.

ADD REPLY
0
Entering edit mode

Great for this dataset after many months of head scratching. However, the WGCNA package blockwiseModules() function should not leave unsigned, negative kME, proteins in modules of a signed network, regardless of normalization subtleties of the input data. There seems a possibility that something assumed by the algorithm isn't correct for this particular input dataset. Getting a result that contradicts the algorithm settings for output suggests both the algorithm and the input are interacting in an unpredictable way, and it would be good to get to the bottom of this. I can't say the issue is resolved, as until now we have never needed median polish normalization of proteomics data going into WGCNA. However at 11,200 proteins x 243 brain case-samples, this is the largest proteomics dataset I have tried WGCNA with. The bigger the sample size, the more robust the correlation structure should be, and the easier to pick out signed co-expression modules. But not in this case.

ADD REPLY
1
Entering edit mode

Please contact the WGCNA developer. Your concerns and questions are no longer for me to answer.

ADD REPLY

Login before adding your answer.

Traffic: 1920 users visited in the last hour
Help About
FAQ
Access RSS
API
Stats

Use of this site constitutes acceptance of our User Agreement and Privacy Policy.

Powered by the version 2.3.6