
Hi,
I am attempting to find genes whose response to treatment is different depending on the whether gene X is KO'ed out or not.
So I have an experiment where I have condition + treatment + condition:treatment .... where condition is KO or WT and treatment is Ctrl, M1, M2 (i.e. grown on different media).
So I do the standard
dds = nbinomLRT(dds, full= ~ condition + treatment + condition:treatment, reduced = ~condition + treatment)

 results.interaction  = results(dds)

 table(results.interaction$padj < 0.1)

FALSE  TRUE

16183     5

hist(results.interaction$pvalue)
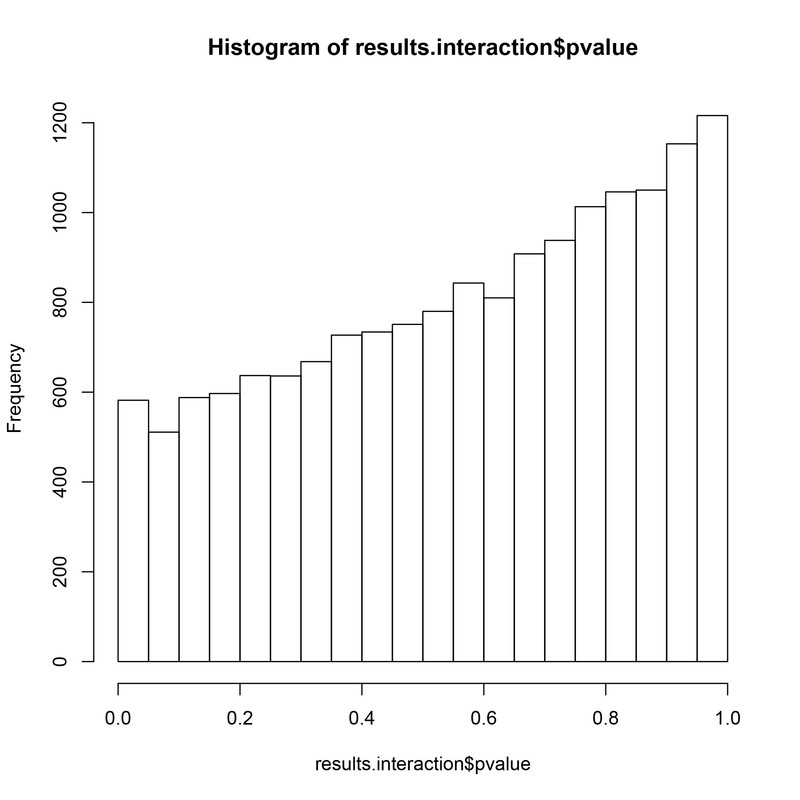
Now from this I see this hill-shaped distribution of p-values which comes from - as I understand - large differences within groups - which I do - if I look at the level of individual genes its pretty obvious that the expression of genes in the KO condition are much more variable than in the WT.
So the question what is the best way of proceeding with this / fixing it. Are there more diagnostic tests I should do first before even considering this?
I have found a lot of talk/presentations/posts using fdrtool to reestimate the p-values and go from there. Typically by taking the stat from a DESeq2 result and using this to re-estimate p-values. However I am really after all those genes with a significant interaction not those that I can identify from pairwise comparisons (i.e. extracting stat from conditionKO.treatmentM1 or conditionKO.treatmentM2), so ....
corrected <- fdrtool(results(dds)$stat,  statistic= "normal", plot = T)
table(corrected$qval < 0.1)
FALSE  TRUE

12971  3219
Is using FDRtool to recompute p-values the best option in this situation? If not, are there any other suggestions?
Are there diagnostics I should perform to actually say "yes, lets do this" rather than my p-value distribution looks funny?
Is there anyway to implicitly tell DESeq to consider things differently - to account for large variances in the groups ?
Is there something else going on here?
Thanks in advance,