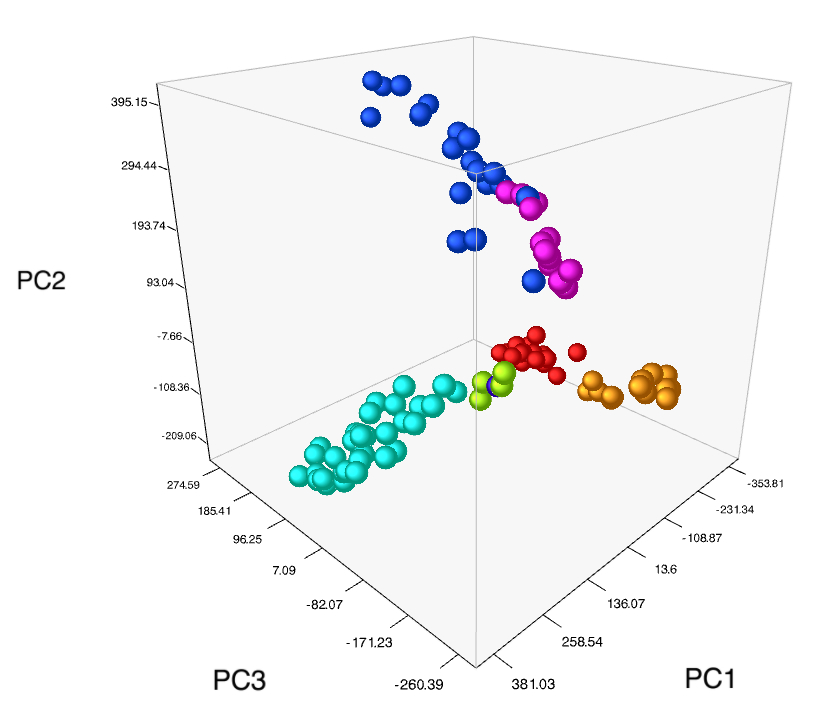
Cubemaker is a visualization tool that lets you import, render, manipulate and share 3-dimensional matrices from within a WebGL-capable web browser, without doing any coding.
I made it for visualizing PCA and PCoA results, but it can be used with any generic, minimally-three column dataset. More columns can be added to bring in feature names and subcategories.
https://tools.altiusinstitute.org/cubemaker/?id=11f4c0cfc3ed2827
Cubemaker can export a persistent web link that you can share and load at a later time, to reload your cube with any display changes.
Links can be useful for presentations, for instance, where a PNG image of the cube has a link that opens Cubemaker and permits live display and exploration. Or you can export a GIF animation and drop it directly into your slide deck, so that your audience can see results without you jumping out to a web browser. Or you can bring the publication-quality PDF into Adobe Illustrator and mark it up for a paper.
More information is available about inputs and outputs, along with links to demonstration cubes and sample matrix files, in the Cubemaker overview. (It's an older PDF, so just replace "stamlab" with "altiusinstitute" in any URLs.)


 You can try BioVinci. The 3D scatter plot there seems to work really well. It also performs the PCA, so you don't have to do this in a separate software then transfer the result to a graphing tool. I like the fact that it lets you interact with your 3D plot (zoom in and out, rotate, showing the info when you hover your mouse). It's here:


I want to have something like this: http://lgsun.grc.nia.nih.gov/ANOVA/help.html#pca
I tried using this tool but it out put .wrl file and I downloaded all recommended packages still it cannot open the .wrl file. Thanks for suggestion.